Every trader uses different tools and methods to determine the price movement. They may be based on calculations, analysis, or previous experience.
One such method is Technical Analysis. It is based on previously collected data and past trading charts. By analyzing the data available, investors can infer future market movement for both short-term and long-term investments.
Often, Technical Analysis is used in tandem with Fundamental Analysis. While the former considers financial indicators and past experience, the latter, based on the study of company documents and depends on internal and external factors, avoids biased judgment and predicts the market's direction. The practice of technical analysis can be performed on any type of financial instrument as long as there is historical data available.
What are the features of technical analysis?
The first feature of the technical analysis is the existence of three basic scenarios for the behaviour of an asset in the market:
- Prices in the market reflect the actual value of the asset;
- Prices follow a particular trend or anti-trend;
- Prices repeat their historical movements.
Second, the analysis is carried out within a specific time frame and considers a strictly regulated set of indicators.
Third, the technical analysis is used at certain intervals of 5 - 15 minutes, 1 - 4 hours, or a day, etc.
Types of charts in technical analysis
The trader analyzes charts, which display prices and patterns for different assets. But different types of charts allow the collection of different data, which will reflect the actual situation to a greater or lesser extent.
In total, there are three types of charts:
- Candlestick;
- Bar;
- and Line Charts.
Let's look at each of the charts in more detail.
Candlestick
Candlesticks allow investors to identify profitable trades. Depending on the situation, such a chart may be represented by one or more candlesticks.
Candlesticks show the price activity during a particular period of time. So, the upper part of a candlestick shows the highest price at which an asset was traded during the time frame, and the lower part shows the lowest. The candlestick body displays the opening and closing prices in the interval.

Based on the candlestick data, traders can:
- Buy strong positions that can grow and sell those that have lost their upside potential and will stop growing in the future.
- Exercise flexibility in working with patterns. The real situation will not always repeat what is written in textbooks and manuals. It is necessary to assess the changing market sensibly.
- Identify the preceding trends. If the current trend is bearish, the appearance of a bullish trend afterward is likely, and vice versa.
Bar
A bar chart is presented as a set of vertical lines, which allow the investor to determine the opening, high-low-low, and closing prices. It is the simplest type of chart.
The open price is on the left, and the close price is on the right.

Line Charts
Line charts represent the line connecting all closing prices, thus forming a left-right chart. The main idea of this chart is to show the price dynamics from the past to the present of the asset chosen by the investor.

Indicators in technical analysis
Aside from using charts, traders are aided by indicators. They help to analyze and track changes in the market. There is a whole range of useful indicators.
Moving Averages
They are aimed at analyzing price movements. Commonly used are estimates based on 10, 20, 50, 100, and 200. If prices begin to exceed the moving average, the trend is upward. If they fall below it - the trend is downward.
There are three categories of moving averages: SMA (Simple Moving Average), EMA (Exponential Moving Average), and WMA (Weighted Moving Average).

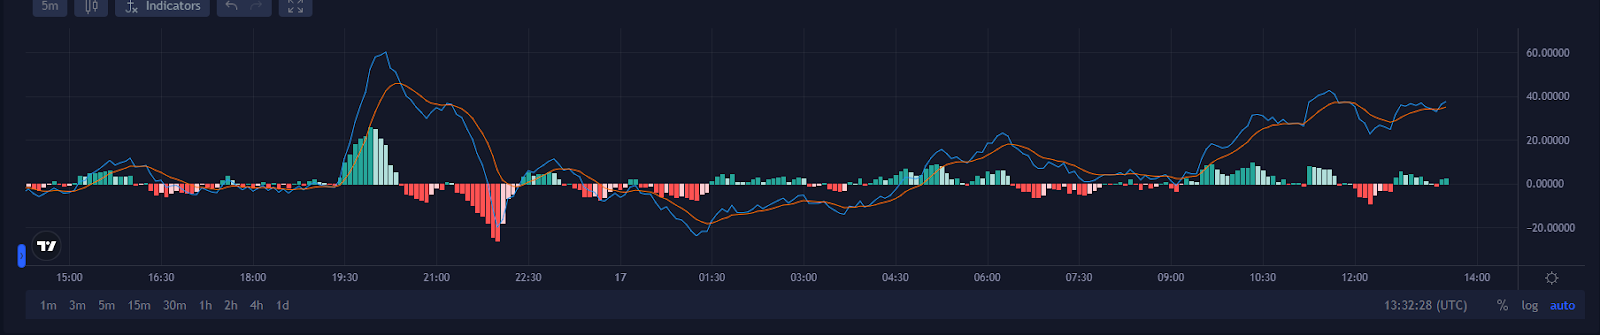
MACD (Moving Average Convergence and Divergence)
This indicator can help you determine whether the current trend will continue or change into another one. The indicator is based on the MACD line - the difference between 26 and 12 periods of EMA and the Signal line, consisting of 9 periods of EMA. If the line crosses the line from above, it is a signal to sell, and if it crosses it from below, it is a signal to buy.
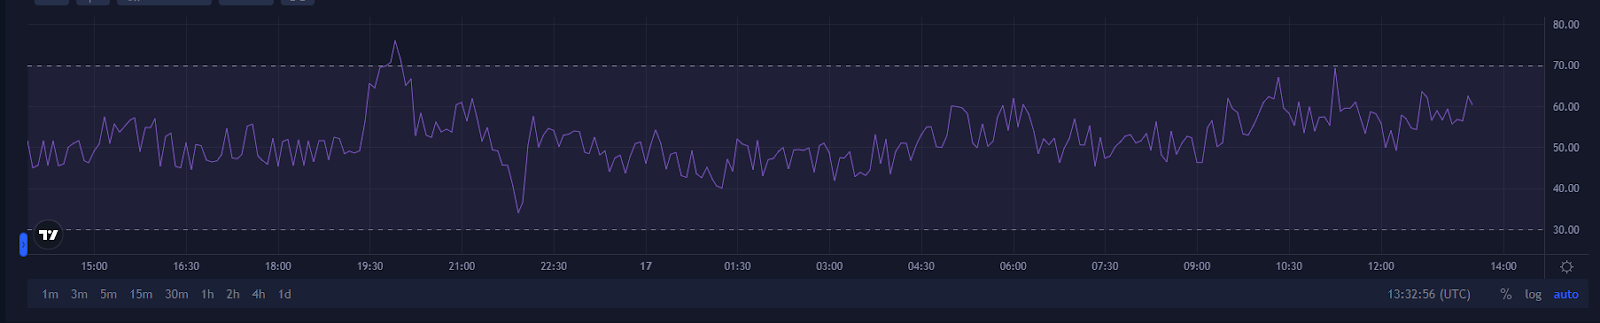
RSI
It is a kind of momentum oscillator, along with, for example, ROC (Rate of Change). This indicator is able to show price fluctuations. Thus, it is possible to determine that assets are either overbought or oversold. It is measured from 0 to 100, where an index below 30 points indicates an oversold condition and above 70 - overbought.
Bollinger Bands
It is an indicator of market volatility. It is measured in three bands, the extreme ones reflecting a deviation by two from the standard. The central one is a twenty-day moving average. The widening of bands reflects growth of volatility, and contrary, contraction means lower volatility.

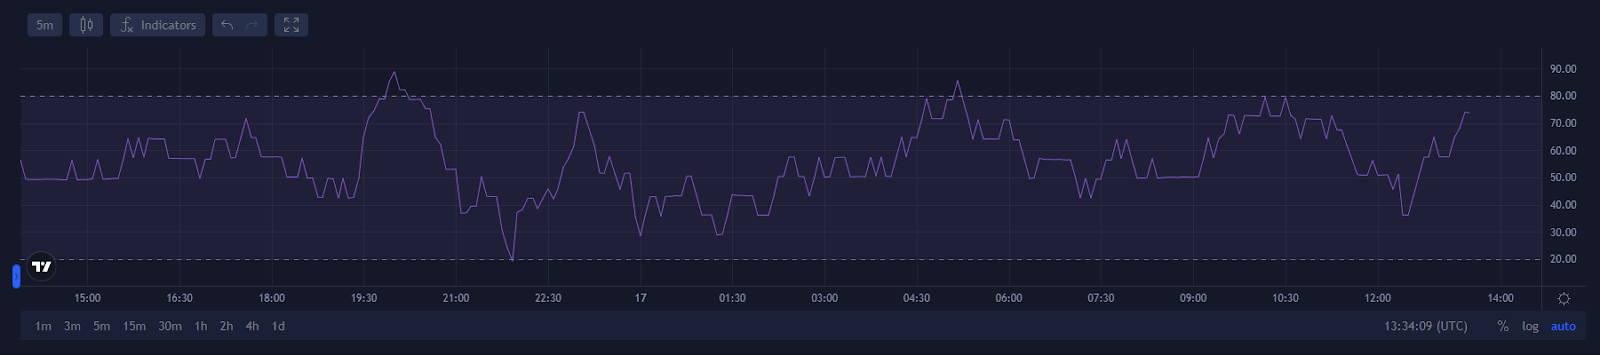
MFI
The Money Flow Index (MFI) is a technical indicator that measures buying and selling pressure. When the MFI rises, it indicates increased buying pressure. When it falls, it indicates increased selling pressure.
It measures from 0 to 100, like the RSI, and reflects the overbought/oversold condition based on the price and volume analysis. The difference lies in the basis of analysis. RSI uses a price perspective, whereas the MFI will indicate a market scenario based on price and volume.
Technical analysis is a useful tool for cryptocurrency investors
The technical analysis incorporates a large number of tools and approaches to identify market potential and risks with a high degree of accuracy. It is a powerful tool for traders, as it helps them predict the next movement of the market and make successful deals.
The upside of Technical Analysis is the ability to predict an asset's value, volume, and volatility, based on its supply and demand. The downside is that only financial indicators are taken into account.
It is good practice to apply these two methods sequentially. You start with fundamental analysis to identify potentially interesting areas for investment and then use technical analysis to calculate risk and estimate the asset's current value.
At the same time, like any tool in a trader's hands, it is not universal. Technical analysis is a useful tool for short-term investors; it does not consider a company's potential but focuses only on its past performance. It is useful for those who calculate their daily strategy for intraday trading since it allows them to observe patterns that might otherwise go unnoticed.